February 27, 2025
<aside> <img src="/icons/reorder_blue.svg" alt="/icons/reorder_blue.svg" width="40px" /> Navigation
</aside>
Table Of Contents:
Post Occurrence Review. Bear & Range
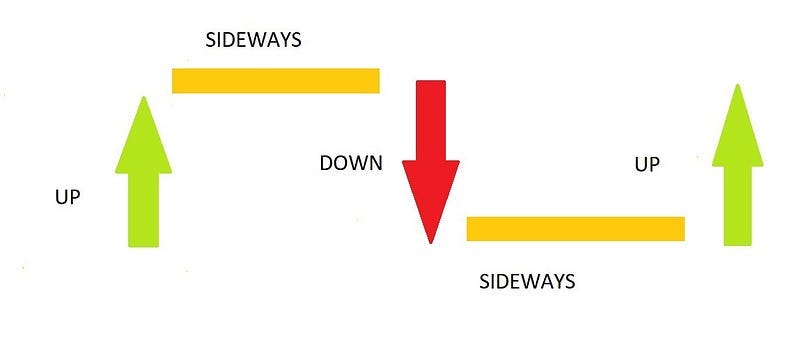
As iterated in this article, to form a complete cycle price goes through a series of 3 major phases i.e. Up, Down and Sideways. These follow each other in sequence separated by the sideways movements as shown below :
Let’s Review BTC Phases from Nov 2021 to Nov 2023
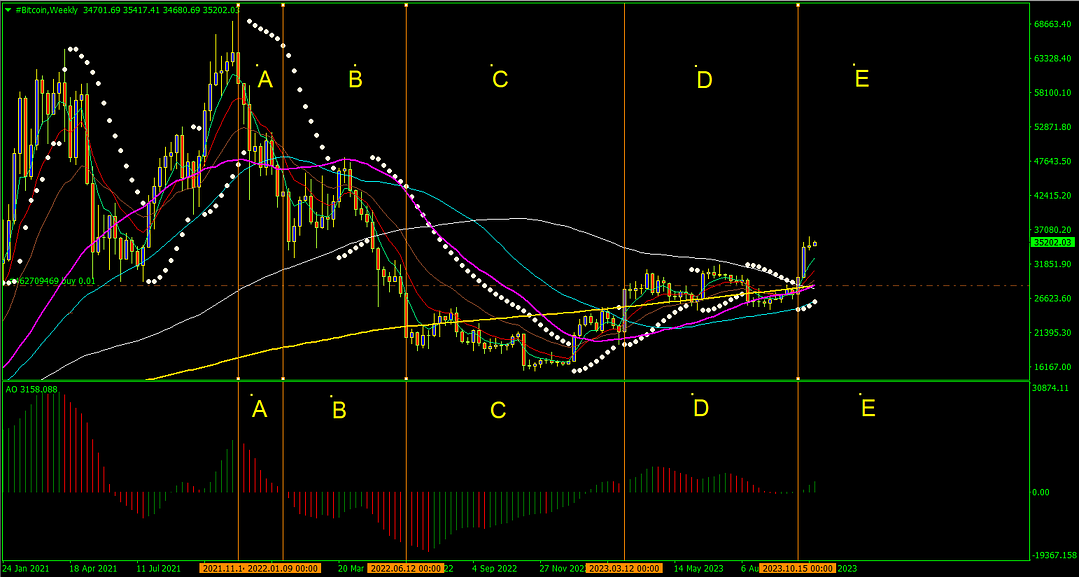
Major Moving Averages to consider:
Zone A: Distribution.
Start: Indicated by Awesome Oscillator above 0, turns from Green to Red and confirmed by EMA5 Weekly > SMA10 Weekly.
End: EMA5 Weekly crossing down SMA35 Weekly
Zone B: Bear.
Start: Price touches or crosses SMA35 Weekly as a leading indicator. Approximately confirmed by EMA5 Weekly crossing down SMA35 Weekly indicates the bear trend’s start.
End: This ended with the price touching SMA200 Weekly a target Moving Average. More accurately, this was indicated by EMA5 Weekly crossing down SMA200 Weekly and was later confirmed by Awesome Oscillator less than 0, changing from Red to Green indicating the change from Bear to Range.
Zone E: Bull Trending.
Start: Started earlier during Bottom Ranging with Price touching SMA35 Weekly followed by EMA5 Weekly crossing up SMA35 Weekly.
Confirmed: Confirmed by EMA5 Weekly crossing up SMA100 Weekly.
<aside> 💡
Best buys are along SMA35 Weekly
</aside>
Estimate Bull High 3 Peak
Estimate Bull High 3 Base
<aside> 💡
New insight added on 27th Feb 2025
</aside>
| Trend | Higher Timeframe | Lower Timeframe | SMA35 Resistance (Lead) | SMA100 cross over (Lead) | SMA150 cross over (Lead) | SMA200 cross over (Lead) | Base Level - Inverse Head(Target) |
|---|---|---|---|---|---|---|---|
| Super Trend | Monthly | Weekly | Between @Fib 0 & @Fib 0.236 (SMA35 Weekly) | @Fib 0.5 (SMA100 Weekly) | Just below @Fib 0.618 (SMA150 Weekly) | Between @Fib 0.618 & @Fib 0.786 (SMA200 Weekly) | Just below Fib 0.786 (SMA50 Monthly) |
| Mega Trend | Weekly | Daily | Between @Fib 0 & @Fib 0.236 (SMA100 Daily) | @Fib 0.236 (SMA100 Daily) | Just above @Fib 0.382 (SMA150 Daily) | Between @Fib 0.382 & @Fib 0.5 (SMA200 Daily) | Just below Fib 0.5 (SMA50 Weekly) |
| Standard Trend | Daily | 4-Hour |
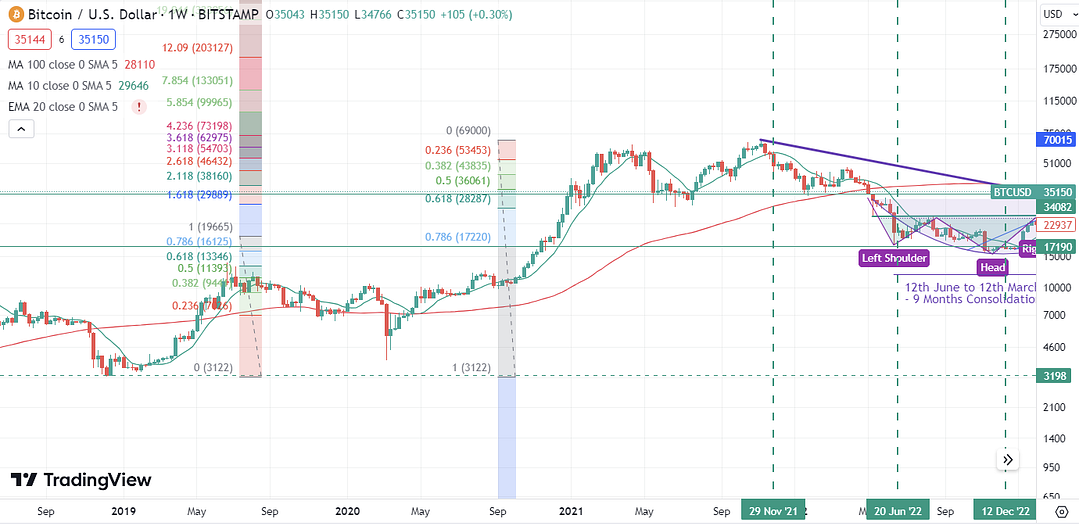
EMA5 Weekly cross down EMA10 Weekly (Super Trend) by week of 5th Dec 2021. Indicating close all trades
EMA5 Weekly cross down SMA20 Weekly by week of 12th Dec 2021. Confirming the end of the Bull trend and confirming Bear Trend.
This indicated the following hints as of December 2021:
<aside> 💡
</aside>
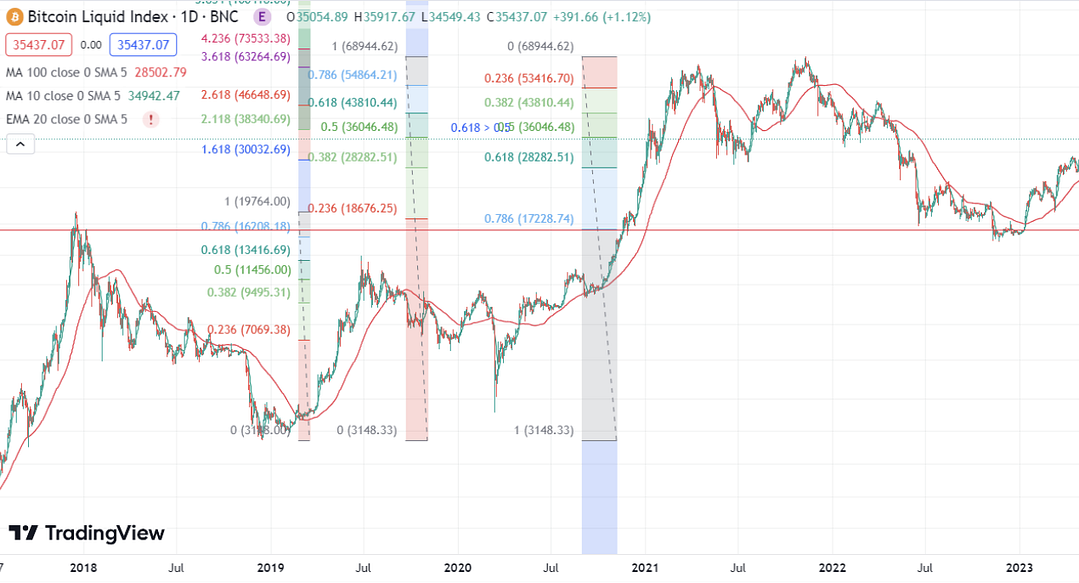
EMA5 Daily cross down SMA200 Daily on 31st Dec 2021 signifying next support to be SMA200 Weekly. SMA200 Daily is ~= to SMA35 Weekly i.e. the Trend Resistance/Support.
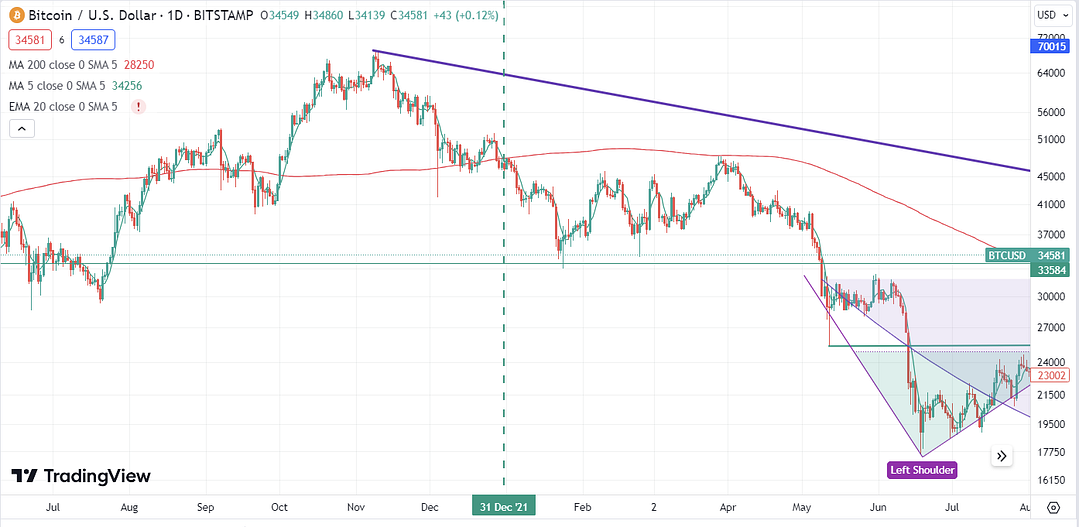
EMA5 Daily cross down SMA200 Daily
EMA5 Weekly cross down SMA100 Weekly on the week of 9th May 2022 signifying next support to be SMA100 Monthly. The Capitulation Candle found its bottom during this week.