February 19, 2025
<aside> <img src="/icons/reorder_blue.svg" alt="/icons/reorder_blue.svg" width="40px" /> Navigation
</aside>
Table Of Contents:
Many new traders usually ask the following questions:
This article will assist you to understand and react accordingly during the times when price consolidates which is when the best opportunities to ride a trend present themselves. Now, this is from an observation I have made from the behavior of Bitcoin in 2017 as compared to 2013 using modeling.
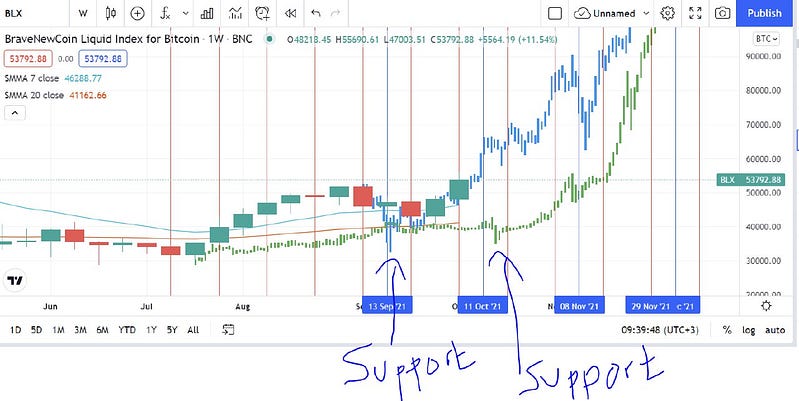
If you look at the 2 models, the green and the blue one. They both got support, at a distance, like 1 month after each other. Question, which one do you think reached the All-Time-High i.e. Peak first? The Green one or the Blue one?
The Correct Answer is: The Green one.
So Green represents Bitcoin 2013 Bull run whereas Blue represents Bitcoin 2017 Bull run. In 2013, the run started on 15th Oct and ended in November the last week i.e. like 6 weeks with an approximate growth of 1,100% . In 2017, it started on 15th September and ended on 15th December, those are like 12 weeks with an approximate growth rate of 500 % to 600% thereabout.
<aside> 💡
Double the time, half the growth percentage.
</aside>
This is the paradox of the market. Let me elaborate below.
This is why trading is very difficult for many people because it doesn’t operate in an obvious manner, however, this isn’t unique.
Consider the following in terms of our lives, what is up comes down and what is down goes up, the cycles. Second, the first shall be last and the last become first. I call this the scissor effect.
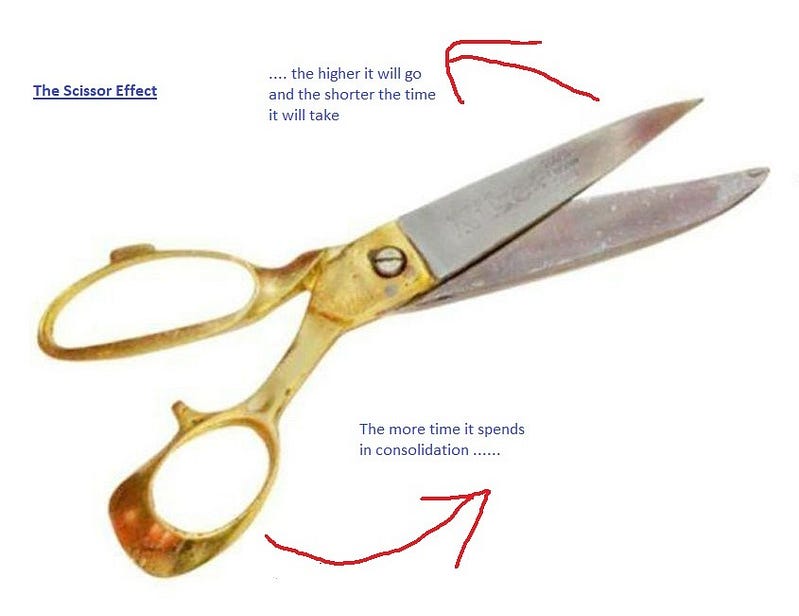
‘The Scissor Effect’.
When the handle (start point) moves down, the blade (the end point) moves up. The slope to move from start to finish becomes very steep. Consider the blade moving being the time price takes to consolidates in a range, the more time it spends there the bigger the accumulation the bigger the trend that is coming.
<aside> 💡
Based on analysis I thus discovered the following:
Using Bitcoin as our study subject, the mid point of transition (scissor) is November 9th where we the price is expected do the first quick pullback of 3 days by 20%. A retest of the previous All Time High. So for now we expect it to go to 80K by Nov ‘21 a retrace to 64K and continue the journey to 200k and above.
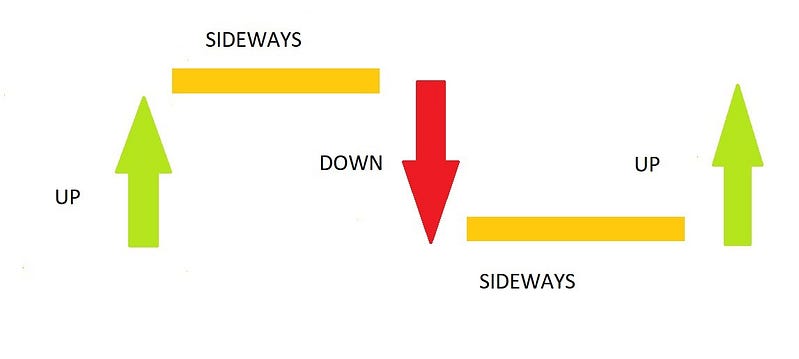
Price can move in 3 ways. Up, down or sideways.
The sequence goes like this Up > Sideways > Down > Sideways > Up in a cyclical manner based on supply and demand. The sideways is normally called accumulation if it occurs after a downtrend and distribution if it occurs after an uptrend. The sideways move is the consolidation move we have just talked about.
<aside> 💡
Patterns
Let’s incorporate 2 options in a combination setup and use it to predict the direction of the third move.
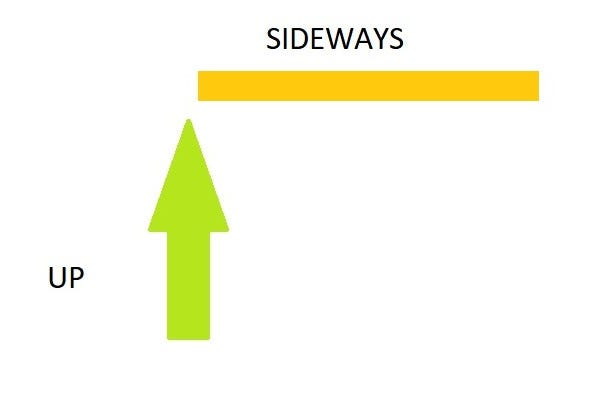
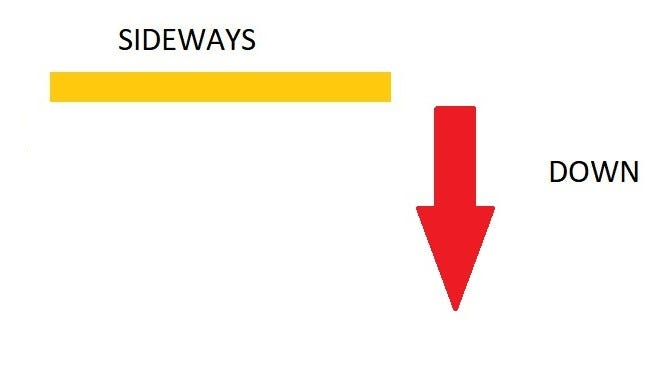
Price has moved up and then consolidated sideways, the next obvious move having exhausted 2 moves is down which is the only move not made.
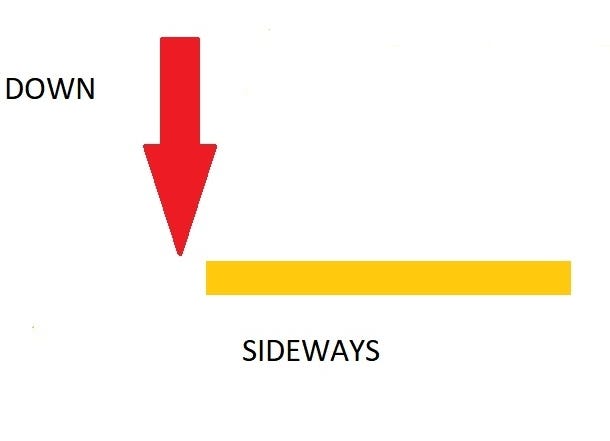
Price has consolidated sideways and then moved down, the next obvious move having exhausted 2 moves is sideways which is the inter-joining move.
Price has moved down and then consolidated sideways, the next obvious move having exhausted 2 moves is up which is the post-joining move.
Price has consolidated sideways and then moved up, the next obvious move having exhausted 2 moves is sideways which is the inter-joining move.
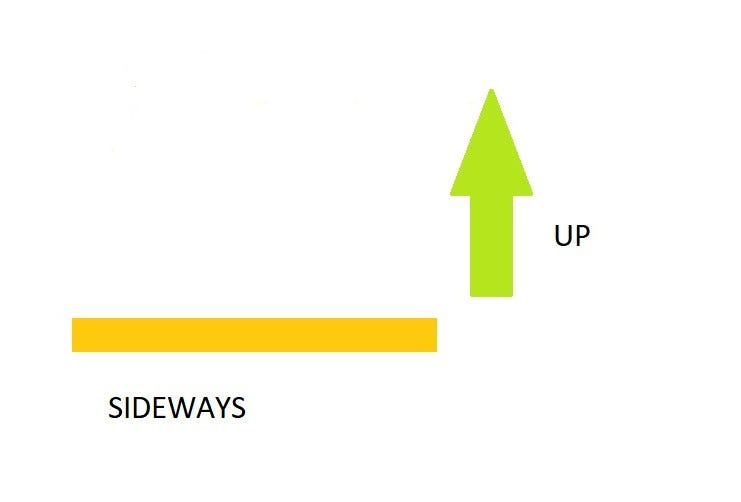
Chart:
Bitcoin Expected Peak in 2025
To summarize, the bigger the consolidation the bigger the trend. A consolidation in a higher timeframe will trend more than a consolidation in a lower timeframe.
To benefit from this, a trader or investor will need to know:
The Trader or investor will also need a lot of patience to avoid making a move early otherwise they will incur charges in form of swap fees or lost opportunity elsewhere, courage to make a trade at the right time when opportunity presents itself and discipline to ride the trend.
The best utility of your time during consolidation times is to prepare for trades when the trend picks up. Use positional calculator to design your next moves and assess risk.