February 25, 2025
<aside> <img src="/icons/reorder_blue.svg" alt="/icons/reorder_blue.svg" width="40px" /> Navigation
</aside>
Table Of Contents:
Good afternoon, I hope you all had a good weekend. Some updates.
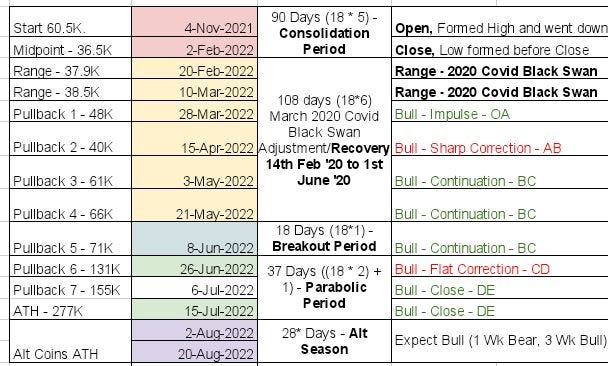
Revised road map
The recovery period is 108 days based on the time during COVID-19 in 2020, when the price went off track for 108 days between 14th Feb 2020 to 1st June 2020.
This means:
By mid May > full recovery to November price level Mid-June Parabolic moves to mid July.
<aside> 💡
25th Feb 2025 - Above projections were wrong.
</aside>
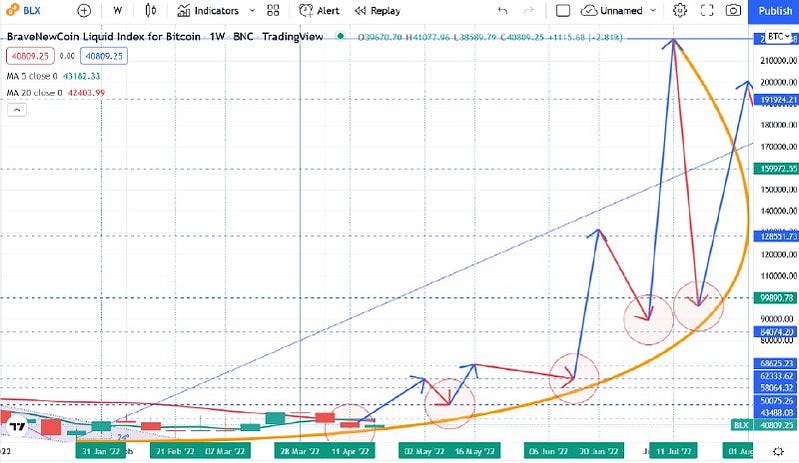
In picture it’s as follows, first a slow recovery in May. Then as you can see it picks up significantly in the last month.
<aside> 💡
Update: Correction > Price did not recover in May but moved down towards SMA200 Daily and ranged from there
</aside>

Analogy: I like to compare the bull run with climbing Mount Kenya. You have a gentle slope at the base and steep slopes as you approach the peak.
The tricky part as you can see from the charts, there are red arrows that show pullbacks. These corrections have the ability to shake many an investor from reaching the summit. This is the risk that we face. The good part is that we know:
Let’s look at an example:
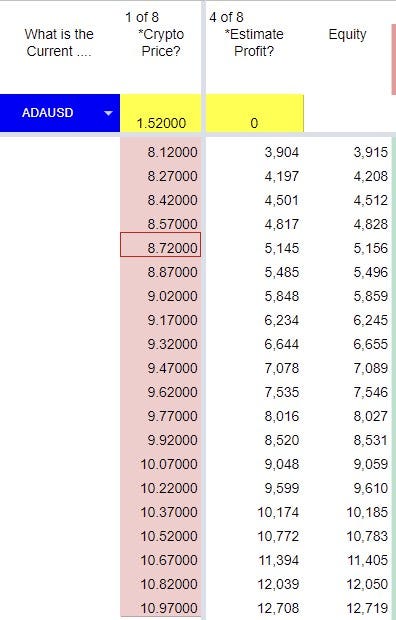
Assume price reaches 10.97$ for Cardano Micro where the total Equity (Balance + Profit) will be 12,719$.
If price corrects to 8.12$ with equity @ 3,915$ i.e. -25% correction.
Total Trades opened at that time will be 61 trades and trades exposed to risk will be 20 trades.
Scenario 1: Assume we do not close any risk-exposed trade
So imagine coming from over 12K$ advantage to around 800$ and all trades closed. So the question is how do we mitigate this risk?
2 strategies I will use:
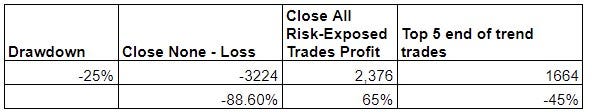
The top 5 trades account for approximately 45% loss.
Closing all risk-exposed trades has the potential of generating 65% of additional equity as profit.
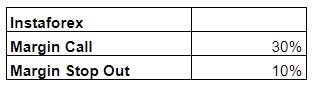
Margin Call is when the broker warns you that you do not have enough balance to sustain your opened trades due to loss.
Stop out is when a broker is forced to close all your trades whether in profit or loss, in order to protect your balance.
Currently, my strategy is using 100% as the base measure of Margin Level Percentage which is high risk because we have or are only willing to risk a little capital. The preferred level is 1,000% and the best is 10,000%, a point in case is ‘one in which a particular company’ used to operate at 10,000% which is a very low risk by the way and good for scalping strategies.
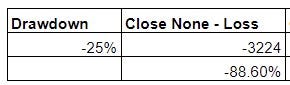
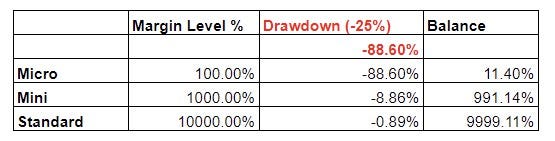
So let’s see the difference:
Price goes down by -25% correction. A micro-sized account is at -88% and near to blowing up. A mini account is just down less than 10% with a buffer of 991%. A standard account is barely touched
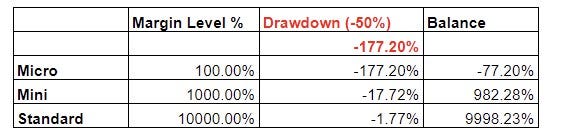
50% price correction, Micro account blew up long time ago, Mini and standard doing well and absorbing the volatility
75% price correction, Mini and Standard holding well
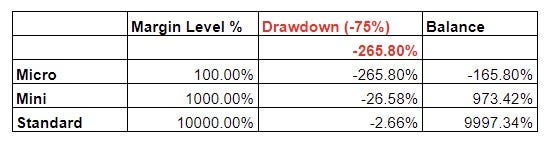
You can see, having an account with good capital can enable us to trade with less worry of blowing up the account i.e. losing your capital.
As I do my part in terms of managing risk trades, there is a part for you to play:
In simplicity, withdraw only 50%. That’s it. Do nothing more nothing less.
You may ask, whether it’s possible for price to correct to that -50% or -75% let alone -95%? My answer is yes.
This is a chart that shows the latest correction (as at April 2022), For BTCUSD, LTCUSD, ETHUSD, SOLUSD it was from Nov 2021 and ADAUSD from Sept 2021. If you look at Drawdown 2022 Q1 you can see that the correction ranged between -52% to -76%.
This information is important so that as we “Hope for the best” we adequately “Prepare for the worst”. It’s like a fire drill just to ensure, that you already factor in corrections in your expectations as an investor and aren’t emotional when they occur.
Most people when you say it’s going up often think like this. A smooth gentle curve. But that’s too easy and out of touch with the reality of the crypto markets
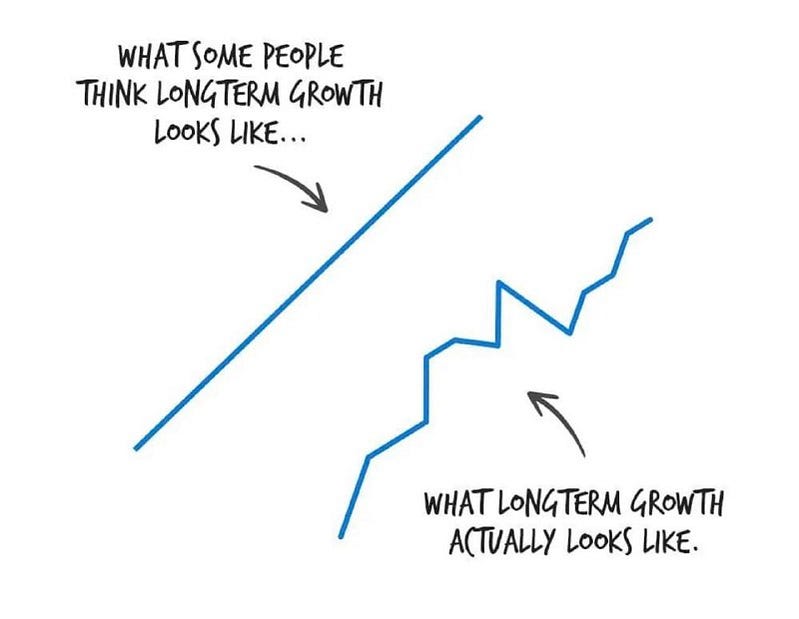
This is more like it but in an exponential way.
As I come to the end of today’s session let me pinpoint that the projection (of correction) is based on a model that has performed consistently for the last 12 months.
The model based on the past review from April 2021 would have predicted Bitcoin’s high price with an accuracy of 122% which means the projected high is met and exceeded by far. Only missing in the month of June 2021. April 2022 is still in progress
The model has also been able to pick the low with a 111% accuracy rate with over 100% meaning the projected low wasn’t hit. Orange which is between 95% to 105% means low was hit with an accuracy of +/-5%. The model only missed May 2021 low. For this year you can see the lowest price has been picked with over 95% accuracy rate.
Have a good evening and week ahead.