February 25, 2025
<aside> <img src="/icons/reorder_blue.svg" alt="/icons/reorder_blue.svg" width="40px" /> Navigation
</aside>
Table Of Contents:
Good morning Team,
It has been a while. Though a lot hasn’t changed materially from what I had earlier posted, let me:
First, where are we, Second what do I anticipate next?
Table of Contents
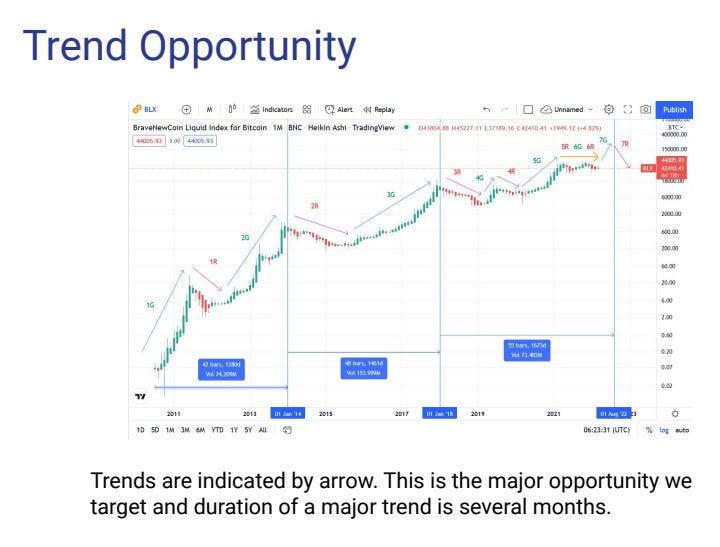
Based on this chart, I noted that we were in 7G (Green — Bull run) which was in April 2022. Looks like we were still in 6R (Red — Bear run) and are still there.
I opened a trade, a discount one at $0.55 and we didn’t wait for $1.28. Status quo remains largely unchanged.
I have also stored the communication with the leaders and team in the blog so in case anyone wasn’t kept in the loop and would like to review here is the link. (Amended from medium to notion on 25th Feb 2025).
(Previous) - Medium Based Blog
(Current) - Notion Based Blog

That being said, let’s review where we are.
I will be reviewing from a Macro perspective in a simple way that everyone is able to understand.
Once we do that you will now understand crypto, fx and other markets.
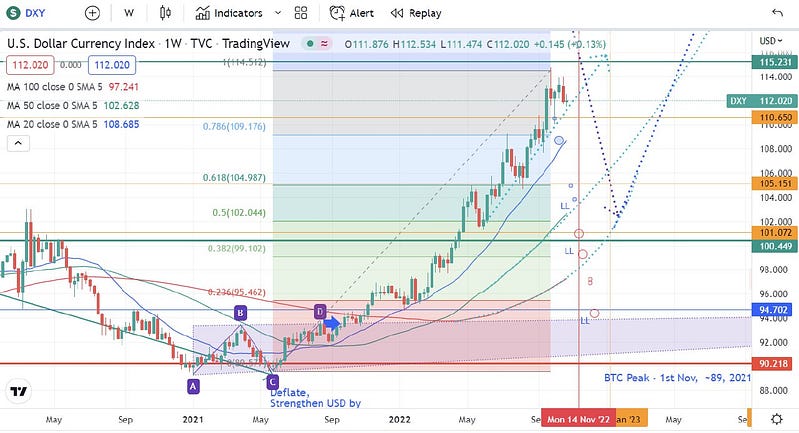
The USD, weekly timeframe. It has been on a parabolic rise from May 2021 to Sept 2022. This happens like once every 20 years. The other times it was in the 2000’s and 1980’s. In 2000’s it started in 1995 to 2001~6 years. In 1980’s, it started from mid 1980 to early 1985 ~4.5 years

One thing to note here is this:
There’s always money it just depends on where it is.
This is its impact on the US stock market from 1920.
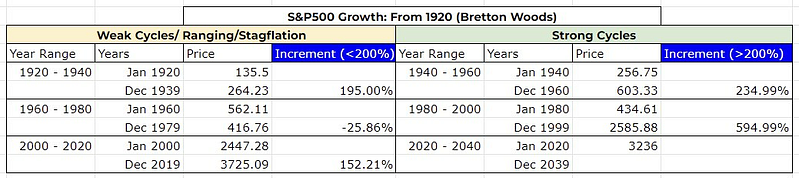
A strong cycle is a growth of above 200%, and a weak cycle is a growth of below 200%. Take note of how the market alternates between weak and strong every 20 years. Especially from 1960.
Added: Assuming full cycle total growth i.e. strong cycle + weak cycle and getting the average of the previous 2 full cycles we get an estimate of 500%. Taking the difference of the weak weak cycle for the period 2000–2020 we get 347%. Multiplying this by starting price gives us 11K$ by 2039 as a probable estimate.
For Gold, the opposite happens to US stock market.
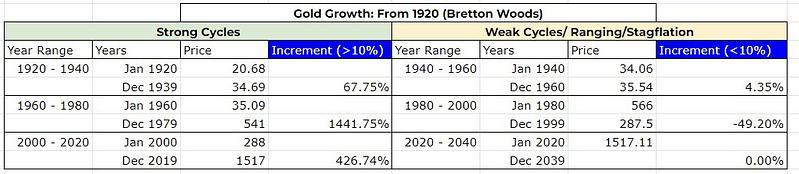
Our benchmark here is 10%. Above 10% is strong, below 10% is weak.
For Oil, it’s the same as gold from 1960 with earlier years being an exception. I will explain why.
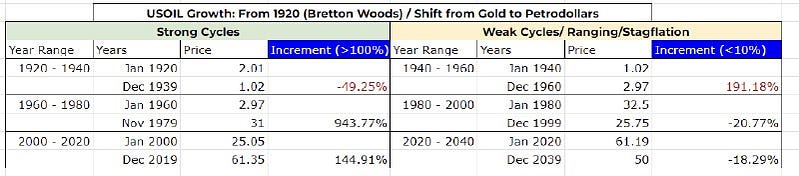
Benchmark here is 100%, Greater than 100%, strong. Less than 100%, weak.
NOTE: Initially US Dollar was backed with Gold. In essence, based on amount of gold the US government, they would print US dollar. In essence, you could go to the bank and exchange your dollar for gold. In the 1970’s US president Nixon shifted from gold to entering an agreement with Saudi Arabia and in essence oil producers, that oil should be bought in USD thus shifting from gold to oil in what they call petrodollars.
Now Kenya goes same with Gold and Oil in being inversely (i.e. opposite) correlated with the US Stock Market S&P500.
![]()
The Benchmark here is 300%. Less than 300%, weak cycle. Greater than 300% GDP growth is strong cycle
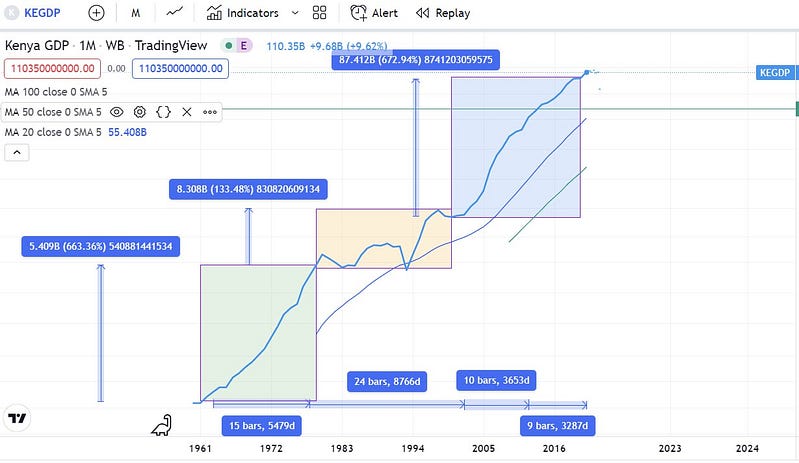
That is how Kenya’s economical growth looks, considering the 20-year cycles
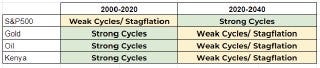
Summary of the different markets. Near similar to Joseph’s “7 years of plenty, 7 years of scarcity” for us we have 20 years of strong growth, 20 years of weak growth.
NB* 2020 -2040 is anticipated if it repeats. For Kenya, if we take different steps the outcome is different. Singapore did it we can. Though we aren’t at the Country level we can do it at the individual level. Here is the gameplay to tap into this great opportunity.
Here is the gameplay to tap into the booming US & Western markets, we either have to:
To invest, one would be looking at what will perform equally to SP500 or better.