February 21, 2025
<aside> <img src="/icons/reorder_blue.svg" alt="/icons/reorder_blue.svg" width="40px" /> Navigation
</aside>
Table Of Contents:
<aside> 💡
Mark Minervini (@markminervini) tweeted at 5:39 AM (GMT + 3) on Fri, Mar 18, 2022:
“With the yield curve close to inverting and high inflation being met with potentially the most aggressive Fed we have seen in years, many are wondering… can the market rally? Historically, it takes a number of rate hikes to cause a recession and materially affect the stock market. https://t.co/6OtIYmWFSU”
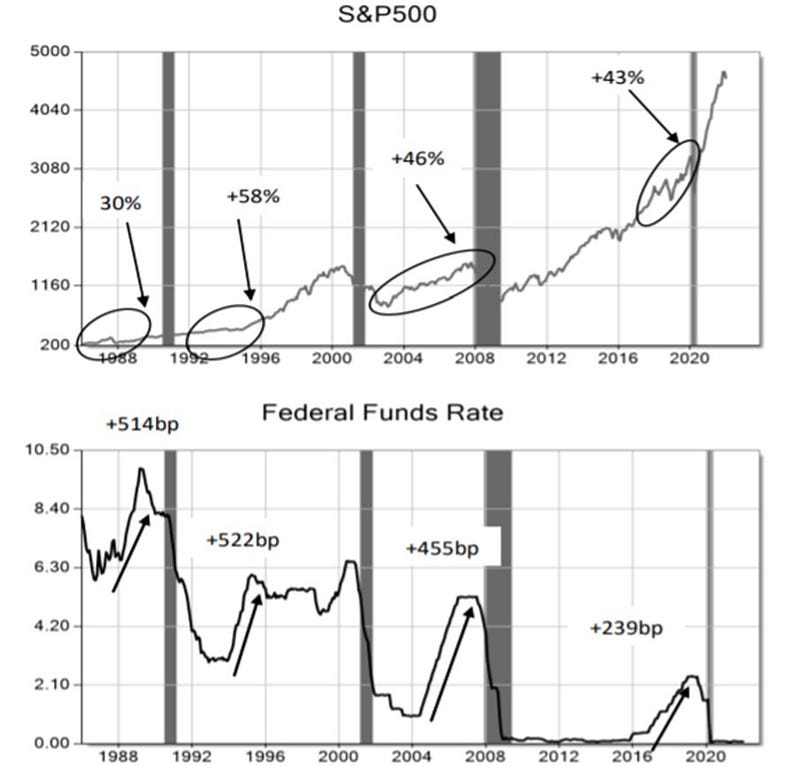
| Period | Federal Fund Rates | S&P 500 |
|---|---|---|
| 1988s’ | +514bp | +30% |
| 1994s’ | +522bp | +58% |
| 2005s’ | +455bp | +46% |
| 2016s’ | +239bp | +43% |
| 2022s’ | +525bp | +54.93% : Open: $4260.58 (16th March 2022) / $6600.98 (15th Sept 2025) |
Based on research done for the above data I made the following discovery:
<aside> 💡
The Fed rate is considered as United States 1 month Government Bonds Yield which you can view in TradingView.com.
</aside>
#Discovery > Between 0 & 1 Fed Rate : +10bp Fed Rate= +1.7% S&P growth
• e.g. 2017 Fed rate @ ~0, +239bp / 10bp = 23.9 * 1.7 = 40.63% (Actual growth 43%)
#Discovery > Between 1 & 4 Fed Rate : +10bp Fed Rate= +1% S&P growth
• e.g. 2005 Fed rate @ ~1, +455bp / 10bp = 45.5 * 1% = 45.5% (Actual growth 46%) ;
- e.g. 1993 Fed rate @ ~3, +522bp / 10bp = 52.2 1%= 52.2% (Actual growth 58%)*
#Discovery > Above 4 Fed Rate : +10bp = +0.58% S&P growth
• e.g. 1985 Fed rate @ ~6, +514bp / 10bp = 51.4 * 0.58% = 29.81% (Actual growth 30%)
<aside> 💡
NB* • 1/1.7 = 0.58 (Inverted).
• Market corrects when growth is achieved, so lowering rate is necessary to support growth • Difference in years +8,+12,+12,+4, • BP means Basis Points and is defined as one-hundredth of one percentage point (used chiefly in expressing differences of interest rates) and is calculated as follows in absolute value, (New Rate - Old Rate) * 100. In percentage, you simply divide by 100 to get percentage points.
</aside>
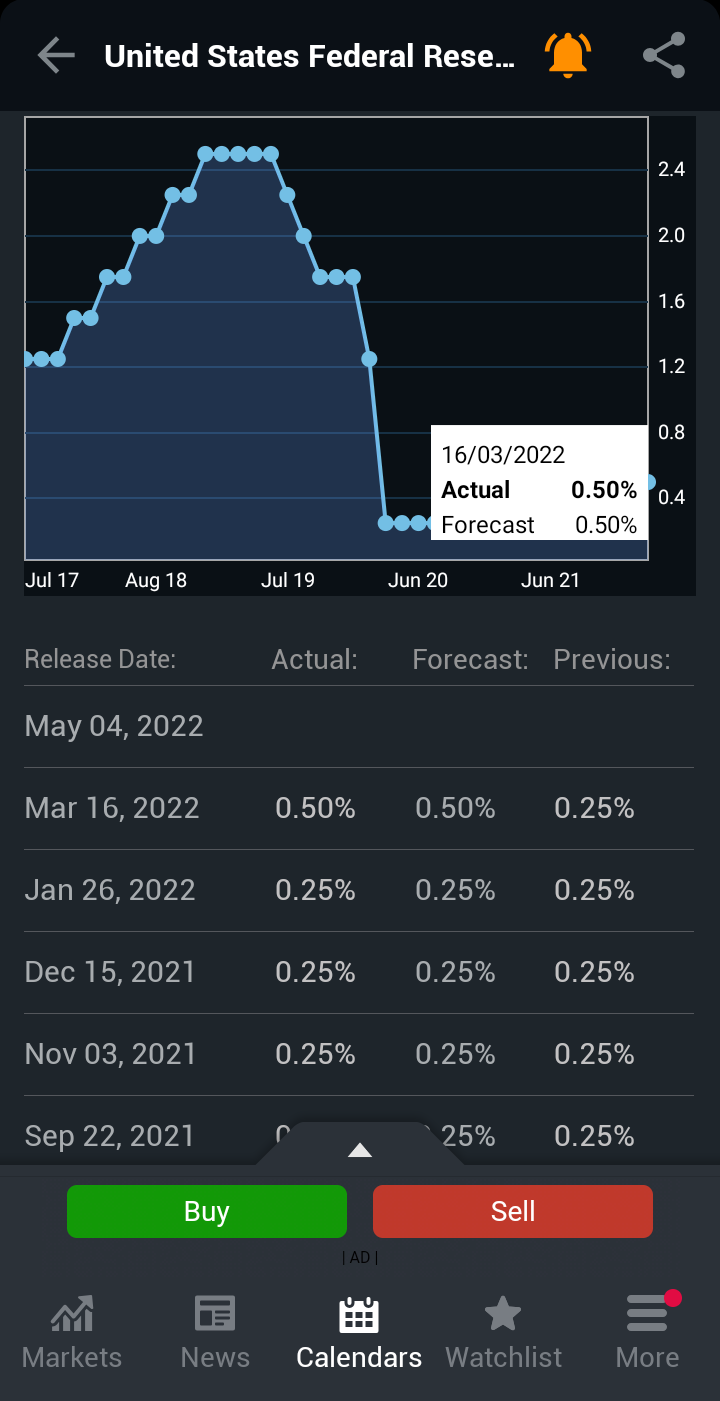
Using the above concept, at the time of this writing is 18th March 2022. Lets use 4,277$ as S&P500 approximate being average of Weekly High @ 4,416$ and Weekly Low @ 4,138$. The Federal rate @ 0.206% being average of Weekly High @ 0.274% and Weekly Low @ 0.138%. The Federal Reserve Bank increased the rate by 25BP on 16th March 2022 as shown below.
Fed rate is Between 0 & 1 : +10bp Fed Rate= +1.7% S&P growth.
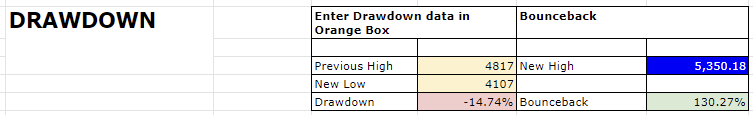
Let’s analyze the drawdown to determine the target price. The drawdown gives us a 1.3 bounce-back increment from lows.
Projection based on Elliot Wave
Update as at 21st Feb 2025

Update as at 15th Sep 2025