February 19, 2025
<aside> <img src="/icons/reorder_blue.svg" alt="/icons/reorder_blue.svg" width="40px" /> Navigation
</aside>
Table Of Contents:
<aside> 💡
NB 2025 Update.* Most of these analyses were wrong as indicated by the red highlight. This is due to a lack of understanding of the Crypto Yearly cycles of 3 Bull Years followed by a Bear Year. That is the Crypto Trend, lesson is don’t fight against it. For drawdown in the Bear Year observe expected max drawdown based on current stage of crypto on its growth cycle, the earlier it is likelihood is below -90%.
</aside>
Exciting times ahead. Some inspiration:
So let’s begin:
Date: 20th Jan 2022
Events Tracker: Events based on Moving Averages are among the best time-tested price action as far as technical analysis is concerned.
Below is a step-by-step Full Cycle Clean-cut Moving Average Events as they occur within the 4 stages of (Bull Trend > Distribution > Bear Trend > Accumulation):
Timeframe: Daily
Bear Market Moving Average Events
Level 1. EMA5 crosses SMA50 going down (triggering reversal — END OF BULL)
Level 2. EMA5 ranges between SMA50 and SMA100 (distribution)
Level 3. EMA5 crosses SMA100 going down (confirming reversal — START OF BEAR)
Level 4. SMA50 Crosses SMA100 going down
*Level 5. Price Pullback to SMA100 as resistance (*Optional — Retest)
Level 6. EMA5 Crosses SMA200 going down
Level 7. SMA50 Crosses SMA200 going down
Level 8. Price Pullback to SMA50 as resistance (Retest)
Level 9. SMA100 Crosses SMA200 going down.
Level 9b. Potential pullback to EMA20 and EMA10 as resistance
Bull Market Moving Average Events
Level 10. EMA5 crosses SMA50 going up (triggering reversal — END OF BEAR)
Level 11. EMA5 ranges between SMA50 and SMA100 (Accumulation)
Level 12. EMA5 crosses SMA100 going up (confirming reversal — START OF BULL)
Level 13. SMA50 Crosses SMA100 going up
*Level 14. Price Pullback to SMA100 as support (*Optional — Retest)
Level 15. EMA5 Crosses SMA200 going up
Level 16. SMA50 Crosses SMA200 going up
Level 17. Price Pullback to SMA50 as support (Retest)
Level 18. SMA100 Crosses SMA200 going up
Level 18b. Potential pullback to EMA20 and EMA10 as support
So let’s review the 5 main Crypto:
Cardano
Litecoin
Based on this we expect in the next two weeks the following double moves.
Let’s have a look at the charts to confirm that Cardano and Litecoin are indeed ahead of Bitcoin and Solana and Ethereum are behind it.
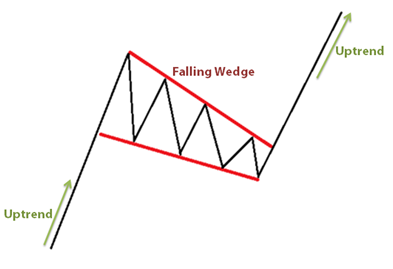
Pattern analysis: This pattern is called a Falling Wedge and indicates an uptrend/bull.
Falling Wedge
Keys:
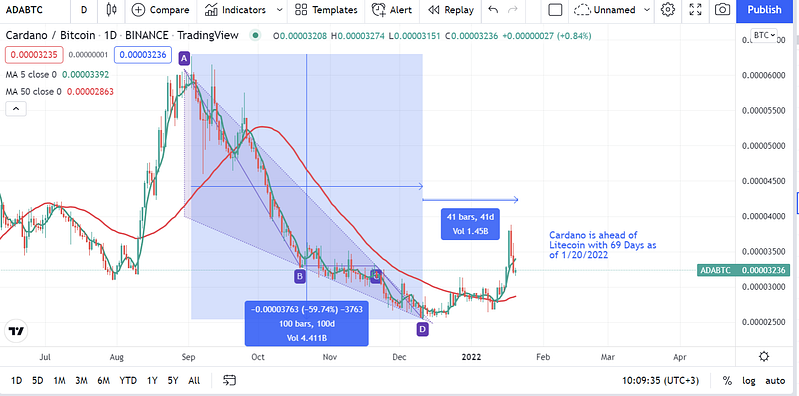
Cardano, ADABTC
Insights: ADABTC
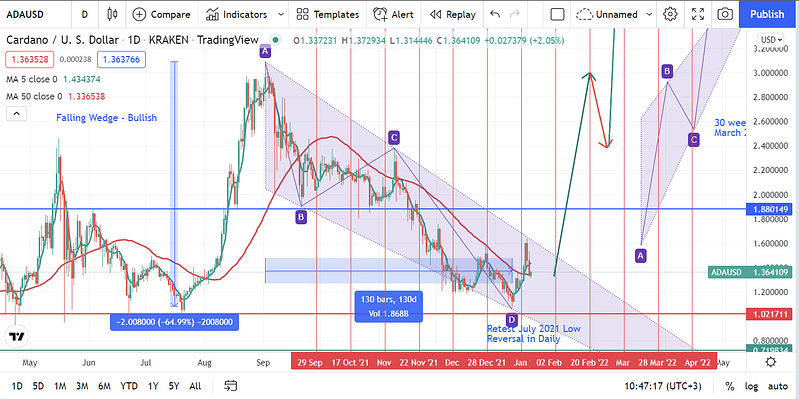
Cardano, ADAUSD
Insights: ADAUSD